
Why Do You Need Sales Forecasts?
A sales forecast is the total expected value of your winnings in a future period.
Having a good sense of what a good sales forecast should look like for your business can help you take timely actions.
Suppose you have noticed that around the 15th of any given month, you are used to forecasting $100k for the following month. If you predict only $80k on the 15th of this month, you may want to ramp up lead generation. That way, you can ensure sufficient opportunities to hit your targets next month, before it’s too late. Without a forecast, you may not be able to act in time.
How Far Can You See?
Typically, longer-term forecasts work better with longer sales cycles.
If it usually takes six months to close an opportunity, every sales opportunity that will close within the next quarter is probably already in your pipeline. That allows you to make more informed forecasts.
If your typical sales cycle only takes a few weeks, it may not be easy to forecast sales beyond a month. If that’s the case, you will need to use sources beyond your sales pipeline to make predictions. These may include your funnel conversion rates, marketing budget, historical trends and market data.
Forecasts May Be Inaccurate. That’s OK.
Forecasts are not always accurate. Fortunately, they don’t need to be.
Consistently predicting upcoming variances is more crucial than precisely knowing how much you will sell in a future period. After all, the whole point of forecasting is to predict undesirable outcomes and avoid them if possible.
To make better use of forecasts, you need to develop a good sense of the relationship between them and actual sales, especially if your sales cycles are short.
Imagine a scenario where it takes two weeks to generate new leads through marketing activities, and then a four-week sales cycle from qualification to closing.
That means by mid-month, you need to decide whether you need to ramp up lead-generation to hit targets for the following month. Any leads not generated by the end of this month will probably not close next month and will not help you hit your target.
Furthermore, roughly half of the opportunities you will win next month are not even in your sales pipeline yet, so you don’t have the data to estimate the sales for the upcoming month accurately.
Despite the short forecast horizon, you may still be able to use available data to make good predictions and take timely actions.
Suppose experience tells you that the mid-month forecast for the following month is roughly 60% of actual sales you can expect. If your target for next month is $100k, and your current projection based on pipeline data is $40k (instead of $60k), you can expect slower than usual sales next month. You may want to consider investing in some additional marketing to hit your target.
As you can see, even without having data about all deals expected to close in a future period, we can make predictions and take corrective actions.
Nothing is Certain Until You Close
Sales opportunities can be unpredictable. Sometimes things don’t go as planned. Competitors make unexpected moves. Buyers change their minds.
You can’t simply add up the values of all opportunities in your sales pipeline and expect to make that much money. Some of those opportunities will be lost. Some others may increase in value. Opportunities that are not in the pipeline may suddenly materialize and close quickly, while others stall indefinitely.
Using Probability to Deal With Uncertainty
Luckily, salespeople are usually good at telling which opportunities they are more likely to win. We can factor this information into our forecasts with a probability multiplier.
Technically speaking, the probability multiplier is a number between 0% and 100%, where 0% means no chance of winning the opportunity (which means there is no opportunity), and 100% means it will definitely be won (which we can never assume until we complete the sale).
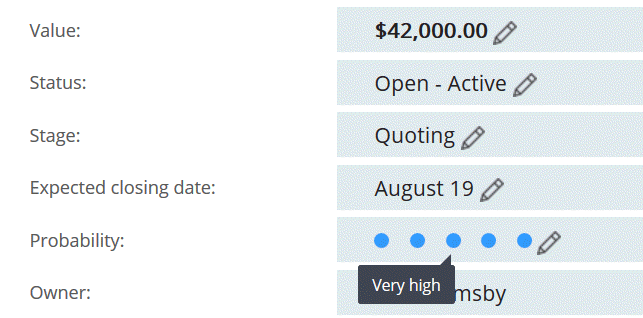
In practice, trying to come up with an exact percentage is futile. Who can say the likelihood of winning an opportunity is precisely 67%, and not 65% or 69%? A better approach is to use a limited number of probability ranges and asking salespeople to choose which one is more appropriate for each opportunity: Very Low, Low, Medium, High, or Very High.
Most salespeople can easily rank their sales opportunities with such a scale. If they feel very confident about winning, they will say the probability is very high. If they are unsure, they will say it is medium.
This probability estimate is an essential piece of opportunity data. In the background, TeamGram assigns a percentage point to the probability rating and uses it to calculate the expected value of that opportunity. An opportunity with a higher probability is more valuable than one with the same amount but a lower probability.
More Opportunities, Better Forecasts
Sales forecasts are made by adding up the amounts of opportunities weighted by probability. The accuracy of this method vastly improves as the number of sales opportunities in the pipeline increases.
Imagine you are selling heavy machinery, and each piece of equipment costs $50k. You have three opportunities expected to close next month, and each opportunity is to sell a single piece of equipment at $50k. If you estimate the probability to be medium for all of them, corresponding to a probability multiplier of 50%, the expected value of all opportunities for next month will be 3 * $50k * 50% = $75k.
This prediction will look odd because the lowest cost item you can sell is $50k, so your sales next month can be $0, $50k, $100k or $150k, but never $75k. The forecast is not very accurate (at best, it will be off by 25%), though it can still be useful when compared in the context of the forecasts of earlier months.
Now imagine the same scenario, but with 30 opportunities in the pipeline, instead of 3. The estimated value of all opportunities expected to close next month will be 30 * $50k * 50% = $750k.
Note that this doesn’t look unreasonable now, as it is possible to close half of these opportunities and hit that estimate exactly. In reality, an additional discount of 5% may be necessary on all sales, and not 15, but 16 of them may eventually be won, getting you to $760k, which is less than 2% off the forecast.
Having many opportunities in your pipeline helps you make more accurate forecasts and consistently hit targets. That’s how large sales organizations predict future sales with almost pinpoint accuracy.
The Importance of Frequently Updating Opportunity Data
Always try to have your best estimates for opportunity values, estimated closing times and probabilities in your CRM.
In the early stages of an opportunity, you will know little about what the buyer needs and what kind of competition you face. You may be less confident about winning and choose a lower probability rating. As the negotiations progress and your confidence increases, you may want to update your estimate.
Similarly, it may not be easy to estimate the final value of a sale in the early stages of the sales cycle. As your quote materializes and negotiations start, you will have a more accurate value estimate.
When you update your opportunity data, TeamGram automatically recalculates forecasts.
Visualizing Predictions
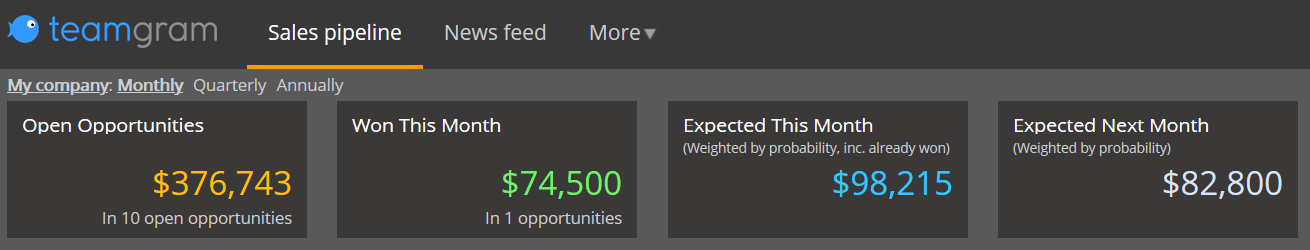
TeamGram has various dashboard widgets and pipeline views that help you summarize forecasts.
Keep an eye on the forecast summary wıdgets above your pipeline. They help you track changes in the near-term forecast. You can change the forecast period using the link above the widgets..
Another useful visualization is the forecast view of the sales pipeline (open opportunities arranged by expected closing months). It shows the expected sales in each upcoming month.
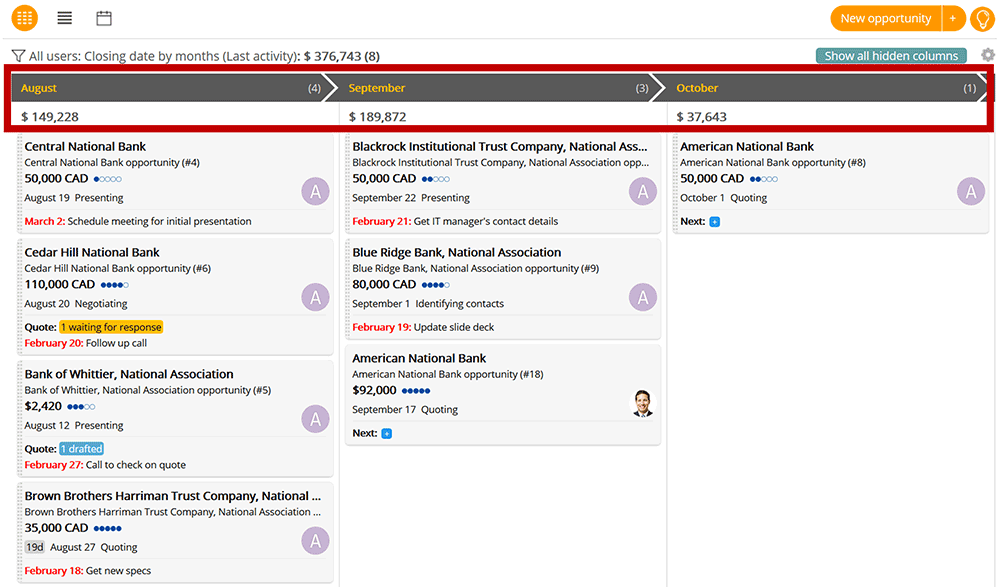
Now head to TeamGram’s sales pipeline page and make sure all sales opportunities have estimated values, expected closing dates, and probabilities. Then check the forecast tools to see what’s coming.
No TeamGram account? Sign up for a trial here.